
Hi everyone, I am back with another post and this time with a much interesting one. Today, I will be writing about using images as the data source in Power BI, yes you read it right, Images. When I came to know about the data source which was images, I was a bit hesitant about whether I should do it or not but then there is always a small voice that pushes you to do some challenging tasks so I took it as a challenge and finally able to develop such a beautiful dashboard.
Before I start, I would like to tell all of you that I have taken help from 3 places so the entire credit goes to Jason Thomas aka SqlJason for his post, Gerhard Brueckl for this post in which he had added a bit to SqlJason’s post and Chris Webb for his work.
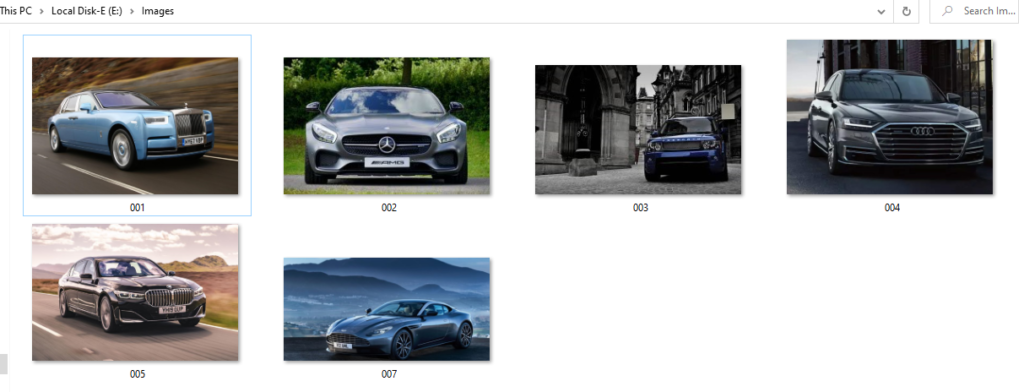
These are the images that I have downloaded and will import in Power BI for further use.
We will open our Power BI Desktop and import the folder where we have kept all these files. So for that, go to
Get Data –> More… –> Folder
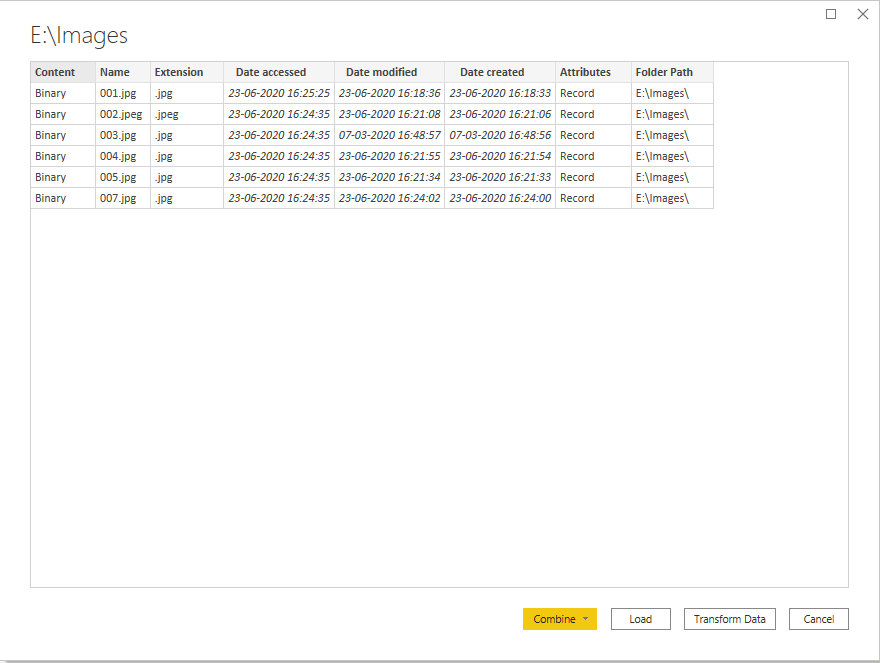
A new dialogue box will appear where we have to specify the folder path. Once done, another dialogue box will appear as shown below where the information related to the files is shown.
Click on Transform Data to go into Power Query editor. The same page will be visible there as well but the context column will have the binary data linked which we will have to extract and modify in text data type.
Now comes the real part where we will use the query written by Chris Webb.
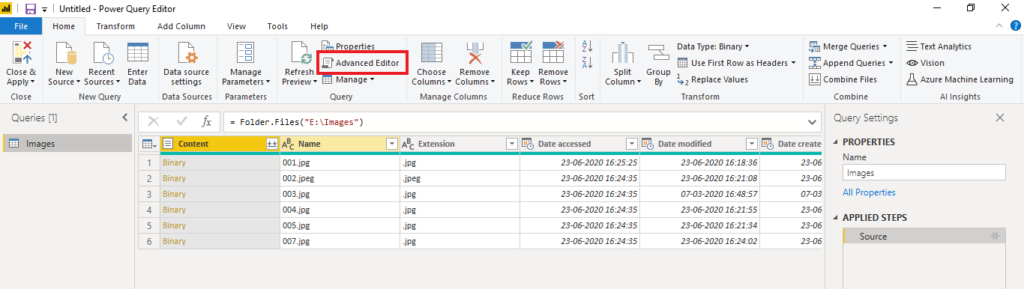
Go to the Advanced Editor option in the Home tab and paste the below provided advanced query to modify the images to text.
let
    //Step-1 Provide the path of the folder where the images are stored.
    Source = Folder.Files("E:\Images"),

    //Step-2 Remove unnecessary columns.
    RemoveOtherColumns = Table.SelectColumns(Source,{"Content", "Name"}),

    //Step-3 Creates Splitter function.
    SplitTextFunction = Splitter.SplitTextByRepeatedLengths(30000),

    //Step-4 Converts table of files to list.
    ListInput = Table.ToRows(RemoveOtherColumns),

    //Step-5 Function to convert binary of photo to multiple text values.
    ConvertOneFile = (InputRow as list) =>
        let
            BinaryIn = InputRow{0},
            FileName = InputRow{1},
            BinaryText = Binary.ToText(BinaryIn, BinaryEncoding.Base64),
            SplitUpText = SplitTextFunction(BinaryText),
            AddFileName = List.Transform(SplitUpText, each {FileName,_})
        in
            AddFileName,

    //Step-6 Loops over all photos and calls the above function
    ConvertAllFiles = List.Transform(ListInput, each ConvertOneFile(_)),

    //Step-7 Combines lists together
    CombineLists = List.Combine(ConvertAllFiles),

    //Step-8 Converts results to table
    ToTable = #table(type table[Name=text,Pic=text],CombineLists),

    //Step-9 Adds index column to output table
    AddIndexColumn = Table.AddIndexColumn(ToTable, "Index", 0, 1),

    //Step-10 Split the Name column so that we can use it as a unique key
    #"Split Column by Delimiter" = Table.SplitColumn(AddIndexColumn, "Name", Splitter.SplitTextByEachDelimiter({"."}, QuoteStyle.None, false), {"Name.1", "Name.2"}),

    //Step-11 Rename the splitted column to ID
    #"Renamed Columns" = Table.RenameColumns(#"Split Column by Delimiter",{{"Name.1", "ID"}}),

    //Step-12 Remove the unused splitted column
    #"Removed Columns" = Table.RemoveColumns(#"Renamed Columns",{"Name.2"})
in
    #"Removed Columns"
When you will read Chris Webb’s post, he has mentioned that text value in Power BI has a limitation of 32766 characters so when we convert the binary into text, some files may exceed the 32766 characters limit and to tackle that we have to break these text into small chunks so that we can get full image during the presentation.
In Step-9 you will see that there is an index column that has been added. This is because we will use this index column to combine the chunks of images into a single unit so that we get the exact image.
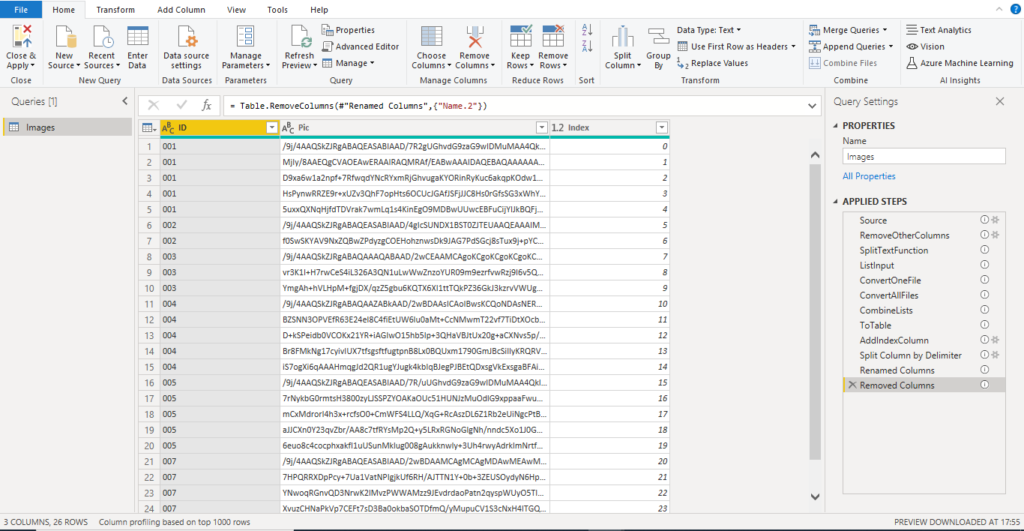
In Step-11 the column has been renamed to ID. You name it as per your preference. Once done with the query part, click on Done and you will get a screen similar to what is shown below.
Now we will create a measure to combine these pieces of images in a single unit for every ID. Use the below DAX code for that.
Display Image =
IF(
    HASONEVALUE('Images'[ID]),
    "data:image/jpeg;base64, " &
    CONCATENATEX(
        'Images',
        'Images'[Pic],
        ,
        'Images'[Index],
        ASC)
   )
Used IF, HASONEVALUE, and CONCATENATEX functions to create the measure column. And don’t forget to change the category of this Measure to Image URL.
To visualize the images, we need to add a custom visual and here I faced a big problem as the visual which I had used earlier, called Image by CloudScope has been removed from Power BI AppSource and I was getting a warning to replace the visual as Power BI will depreciate this visual so I have searched for its alternative and came to know about another visual designated Simple Image by Vicent Faigt but this visual has the biggest drawback that one cannot use measures in it so this was also not useful here.
Next, I got another custom visual named Image Viewer which accepts the Image URL and shows the picture.
These visuals are not present in Microsoft AppSource anymore so there is a legal way and that is to use Table or Matrix visuals but it has also a drawback that the image size will be small. I will show the images in three ways.
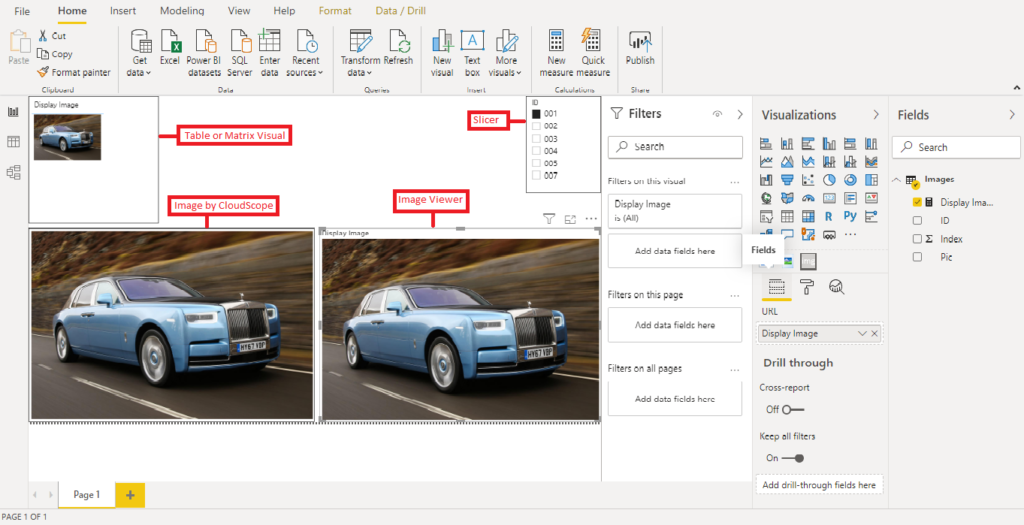
In the above image, you can see that the Table or Matrix visual shows the images very small. You can set the image size to maximum from Format –> Grid –> Image height and drag it to maximum, that is, 150.
The next one is Image by CloudScope. This was the best visual and I loved it but it has been removed by Microsoft.
The third one is the Image Viewer, and it is also not present in the AppSource.
The slicer is playing the part of the filter.
Hope this post will be helpful. Feel free to reach me if you face any difficulty. Soon, I will be coming up with a new post.
Thank You.


Big THANKS! This worked smoothly.
Thank you for appreciating my work. I am glad that it helped you.