Hello everyone. I hope you guys have installed Power BI Desktop in your system. If not then click here to complete that process.
Today in this post, I will be writing about one of the most important topics in Power BI. All of us must have used it at least once or may have needed it in every project. Once we have created it, most of our problems are sorted. Yes, I am talking about the Date Table in Power BI. Every one of us must have scratched our head while creating a Date Table and especially when we have the situation where the Fiscal Year [Note:- I will be using FY to represent Fiscal Year/Financial Year in this entire post] starts from the month of April and goes till March or it starts from July and goes till June. I often see that developers ask questions related to the Date Table in social media groups as well. Recently, I got a project where the client had their fiscal year starting from the month of July and end in June of the next year. It was a bit challenging to calculate every column and sort it. I scratched my head a lot in making the Date Table so I thought of sharing it with you guys so that you can save you time and invest those minutes in further development.
A Date Table basically contains all the columns related to date which are used to develop reports. I will be showing how you can create a Date Table for the FY July-June and April-March. You can use the same logic to calculate the FY for any month range, as per your requirement. The normal January-December FY is very simple, and you can easily make it so I will not be showing that.
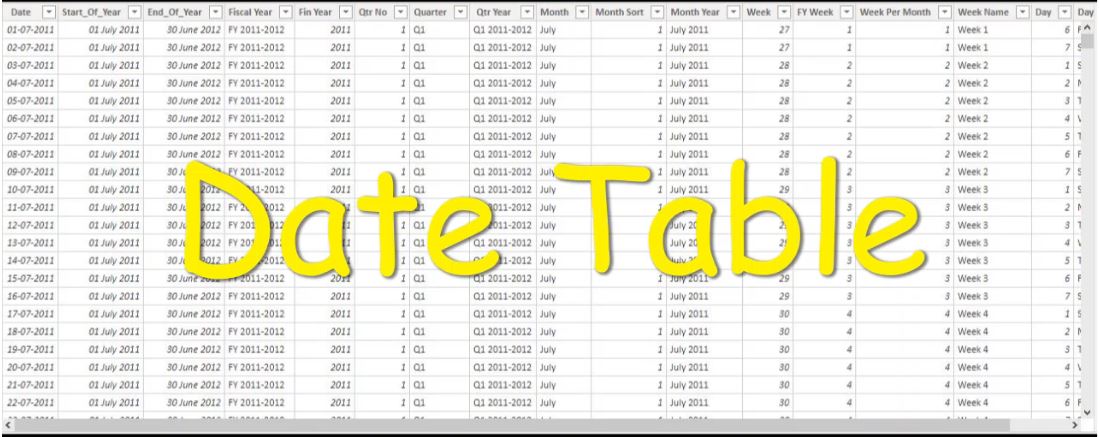
The above image depicts the date table which follows the July-June month range. So let’s start developing it.
The first thing you need to do is to create a New table.

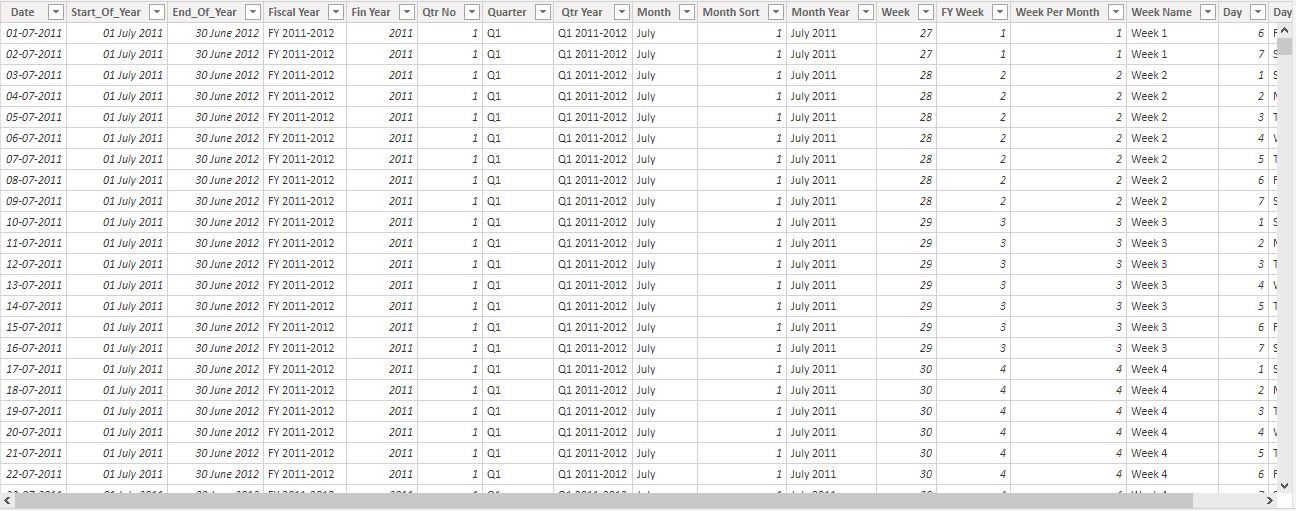
This will create the first column which contains the date. As you can see in the above image that there is continuity in the date and it is very important otherwise it will create trouble while creating the data model.
Date Table = CALENDAR(DATE(2011,07,01),DATE(2015,06,30))I used this CALENDAR function in DAX to create my date table. You can see that I have started the date from 01 July as in my case the FY starts from the month of July. If your FY starts from April then use the below code.
Date Table = CALENDAR(DATE(2011,04,01),DATE(2015,03,31))The next column is STARTOFYEAR (Start_Of_Year). The logic will be the same for every FY. This column will be used in the further calculation.
Start_Of_Year = STARTOFYEAR('Date Table'[Date],"06/30")Now we will calculate ENDOFYEAR (End_Of_Year). By calculating these two values, we have got our beginning and end of FY
End_Of_Year = ENDOFYEAR('Date Table'[Date],"06/30")By using our Start_Of_Year and End_Of_Year column, we will be calculating the FY in two different ways. Both these two ways have different purposes which I will be explaining to you along with their codes.
Fiscal Year = "FY " &
              FORMAT('Date Table'[Start_Of_Year],"YYYY")
              & "-" &
              FORMAT('Date Table'[End_Of_Year],"YYYY")
This DAX expression will give us the value like FY 2011-2012. It can be used for representation purpose as it looks good and understandable. The same will be used for FY April-March.
Fin Year = YEAR('Date Table'[Start_Of_Year])The above calculated FY (Fin Year) will show only a single YEAR which will start from the month of July 2011, the beginning of FY in my case, and goes till the month of June 2012. In this entire 12 months period the value for Fin Year will be 2011 and will change to 2012 in July 2012. The same will be applicable for FY April-March.
Now, as we are done with the year, let’s move one level down to the time hierarchy which is the QUARTER. The below-mentioned code will generate the quarter number of the respective date. So July, August, and September will come under quarter 1 and April, May and June will come under quarter 4.
Qtr No = var Qtr = QUARTER('Date Table'[Date]) return if(Qtr<=2,Qtr+2,Qtr-2)The condition will change when your FY is April-March. Use the code provided below.
Qtr No = var Qtr= QUARTER('Date Table'[Date]) return if(Qtr>=2,Qtr-1,Qtr+3)Using the quarter number, we will calculate the quarter name which we will use in visualization, and to calculate this we will be using the SWITCH function. This condition is suitable for every FY.
Quarter = SWITCH('Date Table'[Qtr No],
            1,"Q1",
            2,"Q2",
            3,"Q3",
            4,"Q4","")
Sometimes the client asks a different way of representation where they want quarter and FY both in the graphs, like Q1 2011-2012 then, in that case, use the below-mentioned query. You can see that I have used the FORMAT function to extract the year from a specific column.
Qtr Year = "Q" & 'Date Table'[Qtr No] & " "&FORMAT('Date
           Table'[Start_Of_Year], "YYYY") & "-" &FORMAT('Date
           Table'[End_Of_Year], "YYYY")
After the quarter, we will be discussing the next level of time hierarchy which is the MONTH. Firstly, we will find the month’s name and for that, we will use the FORMAT function. The same code will be used for FY April-March. This column is used for representation.
Month = FORMAT('Date Table'[Date],"MMMM")The next part is a bit logical. It took some of my time to calculate this but you don’t have to worry as I did it for you but kindly go through the logic once and understand before you copy and paste. This is the (Month Sort) column. Here we will use the VAR keyword to define the variable and then create the column.
Month Sort = var mon = MONTH('Date Table'[Date]) return if(mon>6, mon-6, mon+6)The above code will take July as the first month and June as the last, that is, the 12th month. For FY April-March, there is a slight change in logic. Look at the below-written code.
Month Sort = var mon = MONTH([Date]) return if(mon>3, mon-3, mon+9)Sometimes, the client will ask you to represent the month along with the year like July 2011 so for that use the following code. The same will be for FY April-March.
Month Year = FORMAT('Date Table'[Date], "MMMM YYYY")The next level in a time hierarchy is of the week. Let’s see how we can calculate the FY week through the DAX formulas.
First of all, we will find the normal week through the WEEKNUM function.
Week = WEEKNUM('Date Table'[Date])This will give us the actual week number where the first week of the month of January will be numbered 1 and similarly the first week of July will be 27. Now comes the actual part which is Financial Week. This is also very simple but I will still tell you to understand the logic before doing copy and paste. The same will be applicable to FY April-March.
FY Week = IF('Date Table'[Week]>=27, 'Date Table'[Week]-26, 'Date Table'[Week]+27) We have used the IF function to calculate it. This will make the first week of July from 27th to 1st. If your FY starts from April then use the below code.
FY Week = IF('Date Table'[Week no]>=14, 'Date Table'[Week no]-13, 'Date Table'[Week no]+40)The next one is (Week Per Month). This column is often used to represent the drill down from month to a week. So to calculate this, use the below code. The same will be used for FY April-March.
Week Per Month = 1 + WEEKNUM([Date]) - WEEKNUM(STARTOFMONTH ('Date Table'[Date]))As we cannot represent the week in numbers since it will not get into anyone’s head what the digits 1,2,3,4,…n represents so let’s make it meaningful. We will be using the SWITCH statement to define the week names and we will be using the Week Per Month column for that. Use the below-mentioned code.
Week Name = SWITCH('Date Table'[Week Per Month],
                1,"Week 1",
                2,"Week 2",
                3,"Week 3",
                4,"Week 4",
                5,"Week 5",
                6,"Week 6","")
After calculating Year, Quarter, Month, and Week now come the last one from the time hierarchy, Days. First, we will calculate the day number and according to that, we will find the day name.
For the day number, there is a function named WEEKDAY. We will use that to find the day.
Day = WEEKDAY('Date Table'[Date])Since we got the day number, now we can easily find their respective day name with the help of FORMAT function.
Day Name = FORMAT(WEEKDAY('Date Table'[Date]), "DDDD")This is it. We have successfully developed the Date Table according to the FY. I hope it will help. If you did not get anything then ask in the comment section or email me. Also, share this with other developers.
Thank You.


Very helpful kindly share more dax function
Thank You Aginesh. I will be publishing more such posts in coming days where I will be using DAX functions.
Hi, can i have a video link for the same ?
Hi Anubahv, thank you for viewing my blog. I don’t have any video link for this post.
I think, it worked better as a blog post than a video.
Just amazing and so simple to create Indian-FY . Thank u so so much
Okay Anubhav. I will try to make a video for it. I am happy to see that my post is helpful. I would request you to share it with your colleagues and in other social media platform so that it reaches to other developers as well.
Also, to strengthen knowledge, wher can IF-Var fucntions be learnt?
I always take help from the document provide by Microsoft as it is the official one.
Oh ok, thanks for help
Also, what happens when we are out of year.
For ex: if reach the last day DATE(2015,06,30) (as taken in your 1st column name).
Will it auto-extend?
You have to set the date range as per your requirement. I just took year starting from 2011 to 2015. If you will work on real-time data then check for the minimum date and take 1 or 2 year before that and for ending date, take it 2030.
Ok Great. Thanks
Also, in month column. My months arent sorted ,shows Apr-Aug-Dec-Feb-Jan.
How can achieve this?
Select the Month column and go to the option “Sort by column” and there sort your month column by the month sort column. It will get arranged as per your FY.
Did it. It gets sorted, but when i use chicklet slicer for months, its unorganized as described
Can you mail me at techanswersweb@gmail.com
I wil surely.. Thanks for such an extended support